- Total GPUs (hired and idle)
- Total CPUs (hired and idle)
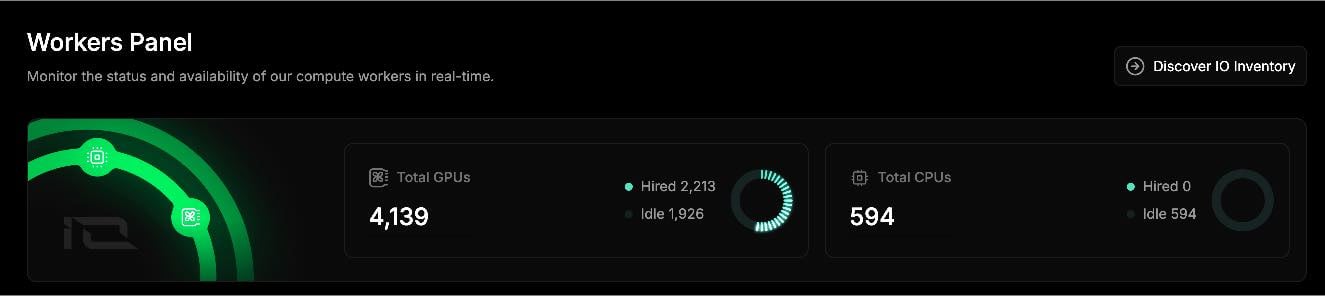
Available Inventory
The Workers tab also highlights available inventory, which includes both active and passive GPU and CPU processors. You can click on a specific processor to view detailed statistics about its usage and performance.
Workers List
The Workers List provides a transparent, real-time view of all connected devices, along with their current operational status and hire activity. The table includes:- Worker Status (active, idle, or under maintenance)
- Link to View Worker Details (for in-depth metrics)
- Hire Status (availability for compute tasks)
- Uptime Duration (how long the worker has been active)
- Device Types & Quantities (detailed breakdown within each cluster)

Worker Details
Users can access a detailed view of each Device by selecting it from the Workers List. The details for each device includes full specifications, utilization metrics, and a breakdown of worker performance.Device Overview Includes:
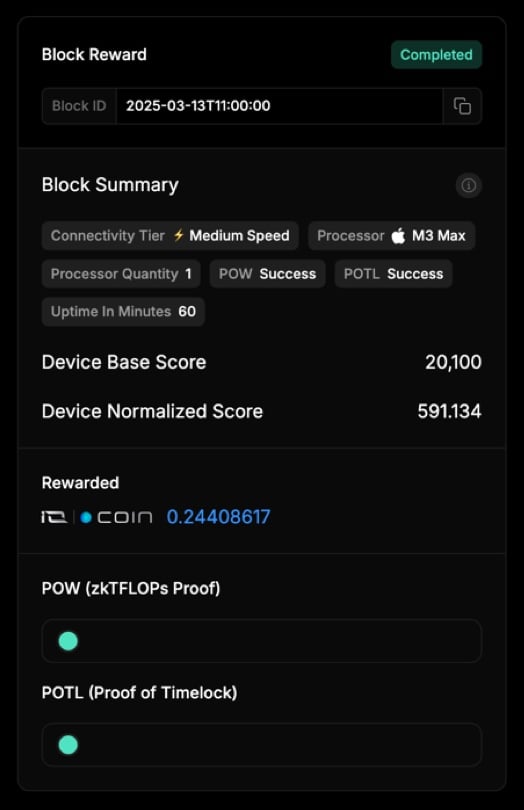
At the top of the Device Overview, users can view:- Block Rewards Nomination Eligibility Status
- Default view shows only pass/fail status for each category.
- Users can expand the section to see detailed criteria for Block Rewards Nominations.
- Uptime Graph for the Last 30 Days
- Easily track whether the device has experienced downtime or remained continuously active.

Main Metrics Displayed:
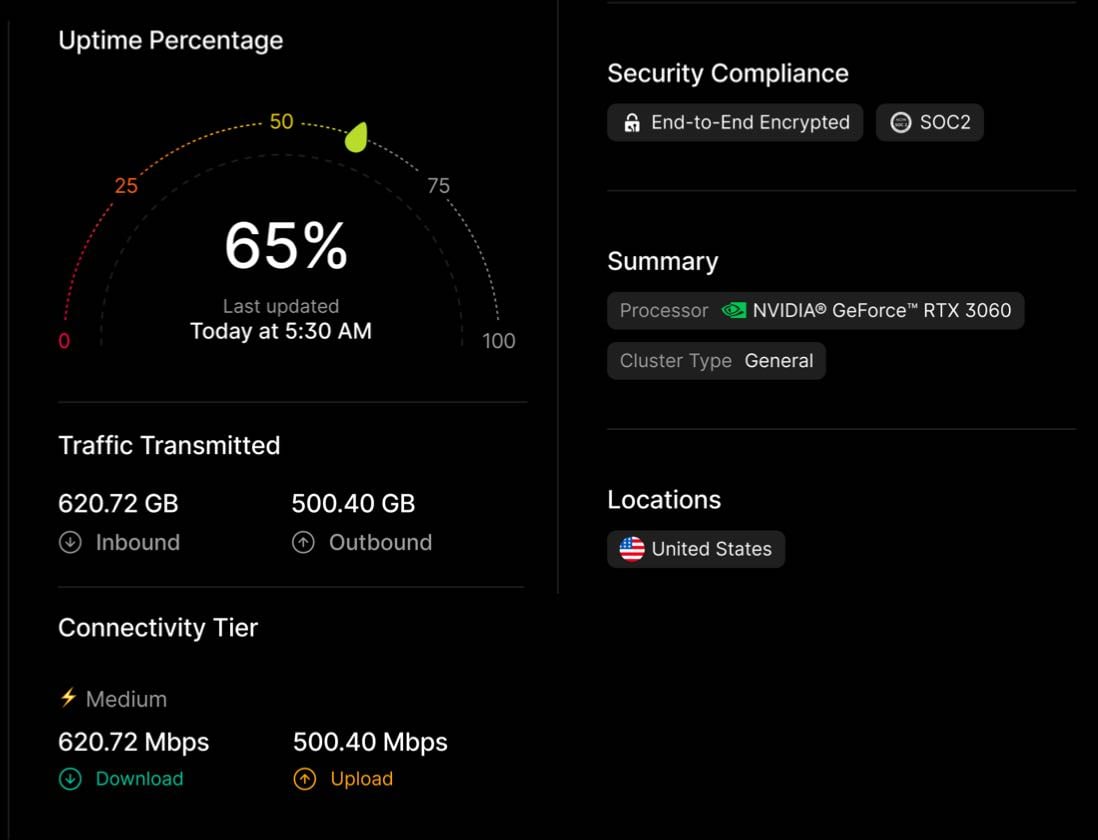
On the right-hand side of the page, users can find key performance indicators for the selected device:- Uptime Percentage (availability over time)
- Traffic Transmitted (data usage and throughput)
- Connectivity Tier (network performance classification)
- Security Compliance (status of security protocols)
- Location (geographic placement of the device)
- IO Version Control Status (software version management)
- IO Monitor Status (device health monitoring)
- Ray.io Status (distributed computing framework status)
See below for the base score calculation: