> ## Documentation Index
> Fetch the complete documentation index at: https://ionet-cca8037f-confidential-compute.mintlify.site/llms.txt
> Use this file to discover all available pages before exploring further.
# Staking Dashboard
> The Staking Dashboard is your central hub for real-time statistics and trends about staking activity on the io.net platform. Crafted for clarity and efficiency, it offers a comprehensive overview of essential staking metrics to keep you updated.
To access the Staking Dashboard, go to **io.net** > **IO Explorer** > **Staking Dashboard**.
 ## Staking Tab
### Key Features
* **Net Staked Amount (TVL in \$IO):** Displays the total value locked in staking, representing active stakes in \$IO coins.
* **Net Staked Amount (TVL in USD):** Displays the total value locked in staking, representing active stakes in USD.
* **Monthly Staked Amount**: Shows the total amount staked within the current month.
* **GPU/CPU With Full Stake:** Lists devices that meet the complete staking requirements.
## Staking Tab
### Key Features
* **Net Staked Amount (TVL in \$IO):** Displays the total value locked in staking, representing active stakes in \$IO coins.
* **Net Staked Amount (TVL in USD):** Displays the total value locked in staking, representing active stakes in USD.
* **Monthly Staked Amount**: Shows the total amount staked within the current month.
* **GPU/CPU With Full Stake:** Lists devices that meet the complete staking requirements.
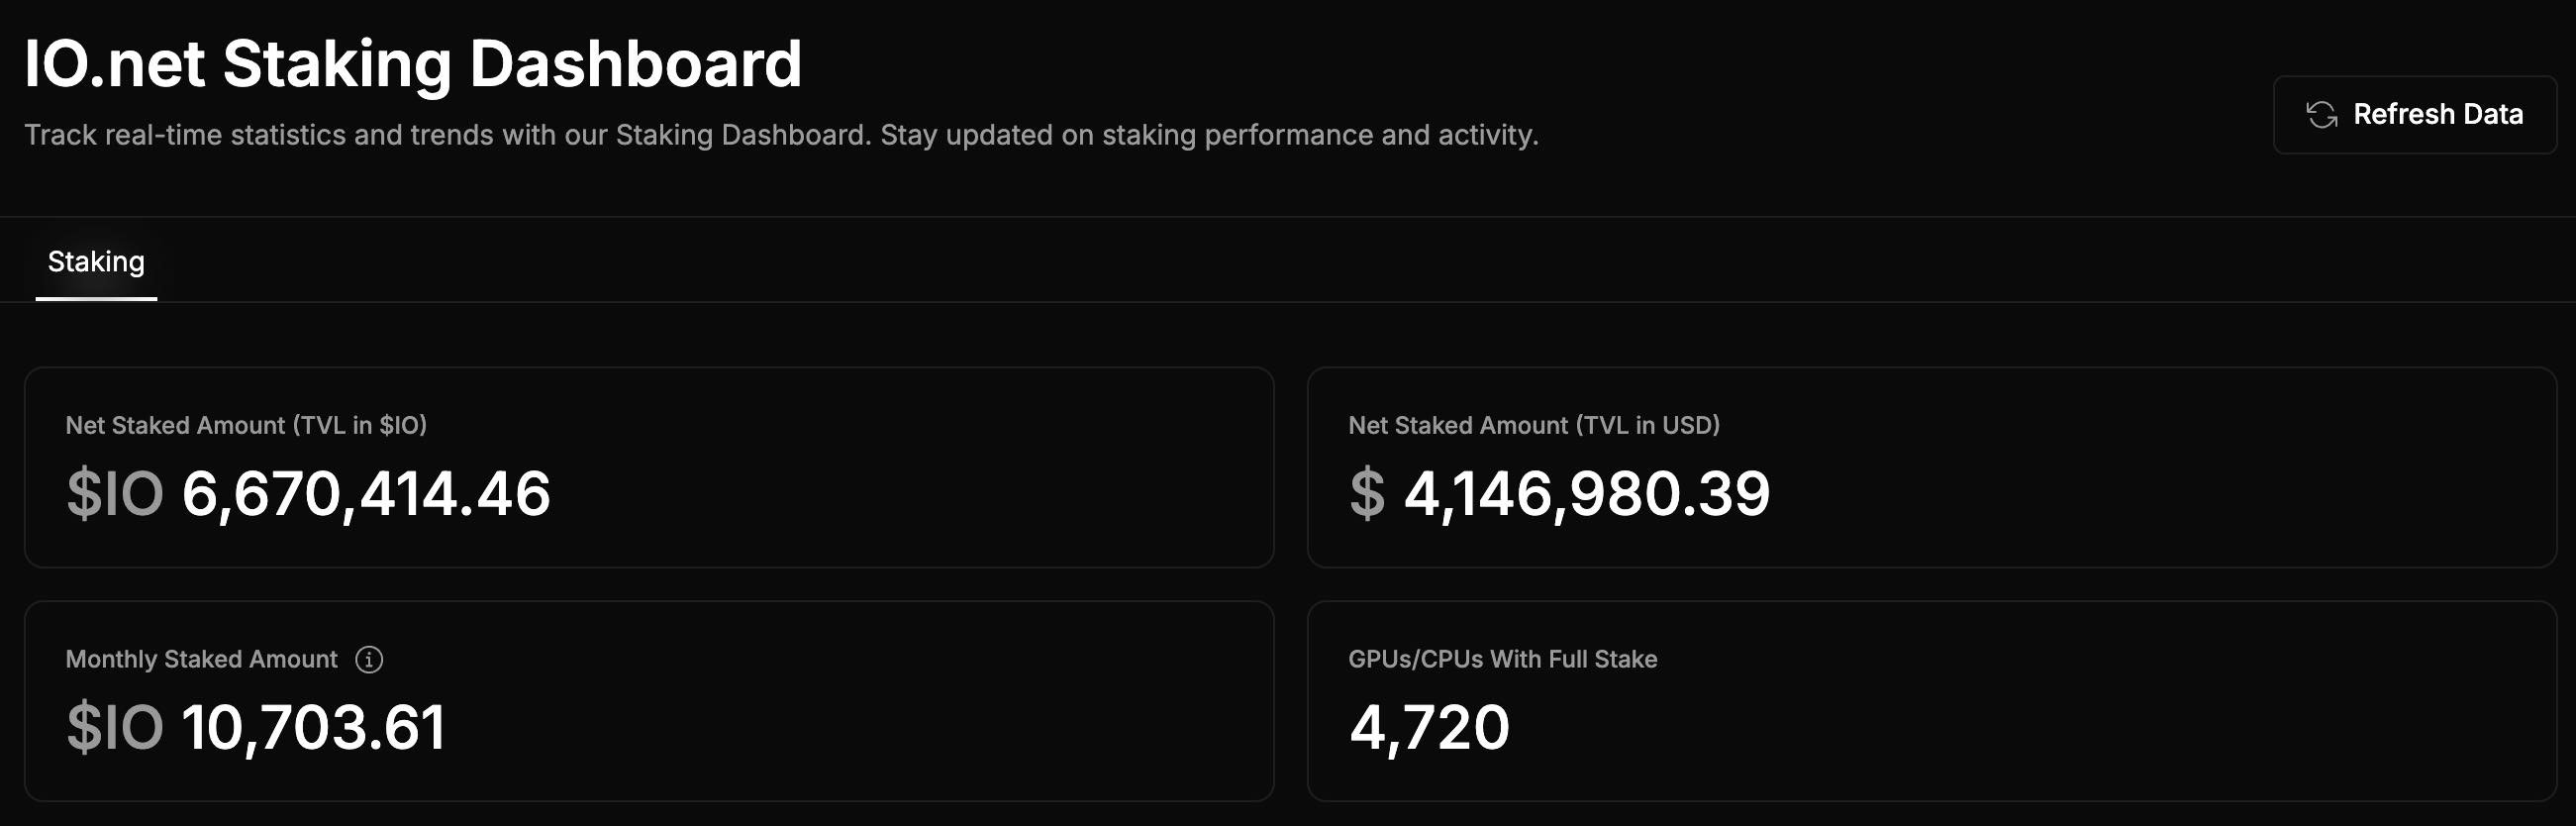 * **Auto-refresh:** All data updates automatically every 10 minutes, but you can get the latest information instantly by clicking the **Refresh Data** button. You can also click the **See it On Chain** button to view it directly on Solscan for real-time data.
### Staking Graphs and Visualizations
The Staking Dashboard includes several key metrics and graphs to help monitor staking performance over time:
* **Net Staked Amount (\$IO)** – Represents active and currently staked funds (*Total Value Locked in \$IO*).
* **Monthly Staked Amount (\$IO)** – Reflects the total amount staked within the current month.
* **Auto-refresh:** All data updates automatically every 10 minutes, but you can get the latest information instantly by clicking the **Refresh Data** button. You can also click the **See it On Chain** button to view it directly on Solscan for real-time data.
### Staking Graphs and Visualizations
The Staking Dashboard includes several key metrics and graphs to help monitor staking performance over time:
* **Net Staked Amount (\$IO)** – Represents active and currently staked funds (*Total Value Locked in \$IO*).
* **Monthly Staked Amount (\$IO)** – Reflects the total amount staked within the current month.
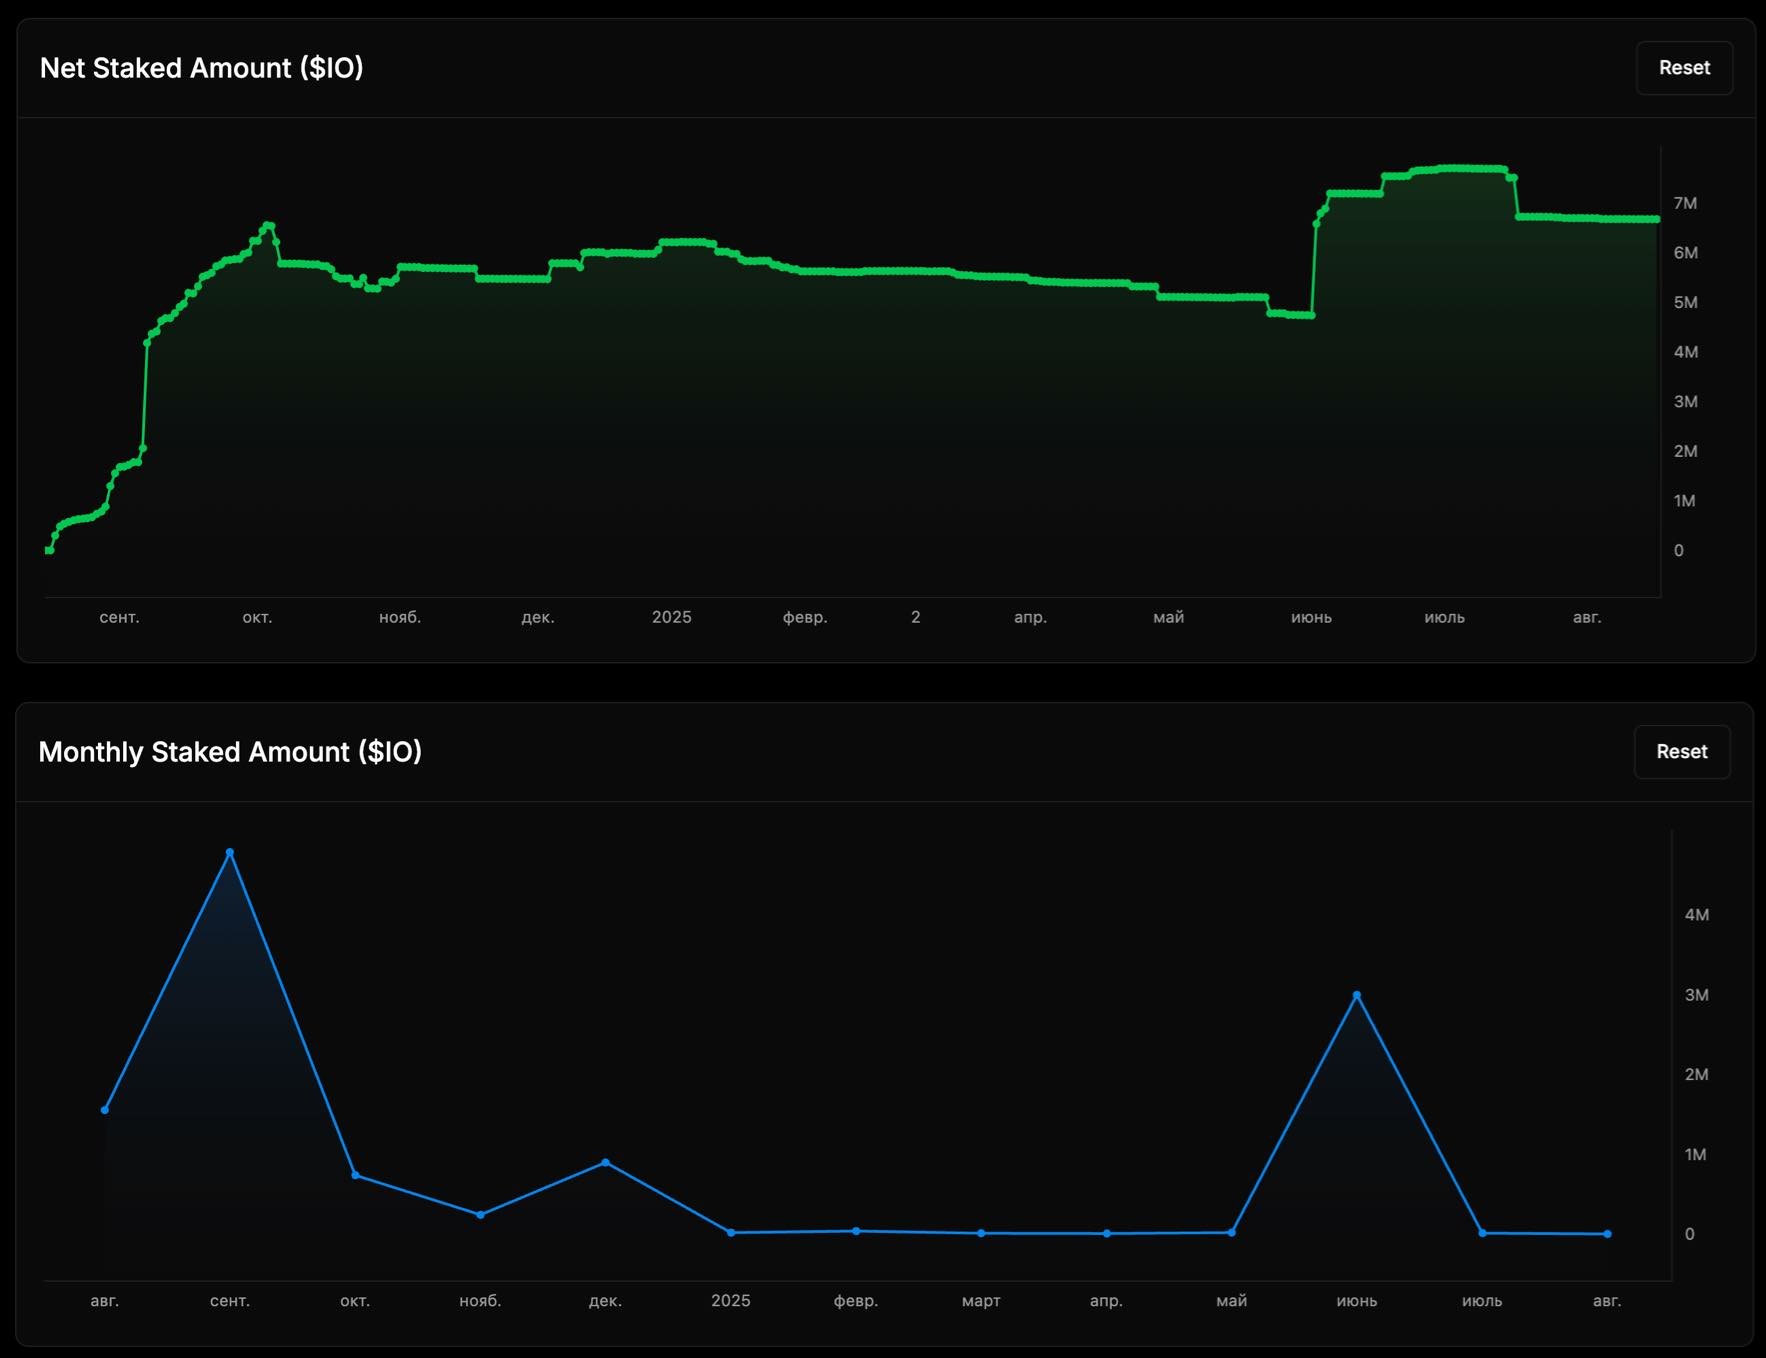 These visuals make it easy to monitor changes, spot trends, and gain actionable insights into staking performance.